
“Celebrate what you accomplish, but raise the bar every time you succeed.”
– Mia Hamm
I don’t care who you are, where you come from, whether you’re an individual or an agency, or whether you’re in or outside of the insurance space… No one, no matter who it is, has the ability to improve without accepting some form of constructive criticism, realizing that they are not perfect, or tracking and taking advantage of where they went wrong and where they went right respectively. How can we ever eliminate our weaknesses if we never begin by identifying them? Similarly, how can we capitalize our strengths if we can’t recognize them to begin with? This is why tracking metrics and analytics within your agency is so crucial, and today, I’d like to tell you a little bit about tracking your website’s metrics in order to capitalize on your strengths, and push your weaknesses aside. You can develop your own constructive criticism by “looking in the mirror” when it comes to your agency’s website (which is your marketing powerhouse), but you need to start with some strong, quantifiable data, and that starts with Google analytics.
An Introduction to Google Analytics
Just in case you’re not familiar with Google Analytics yet, I’ll give you a basic rundown. Google Analytics is a service that you can sync up to your agency’s website to provide you with data, and very accurate data, that will tell you about your website’s activity, engagement, the demographics of your audience, the geographical location of your audience, the number of users and how they behaved on your website, and more. The first place to get started with Google Analytics is to sign up by going to analytics.google.com. Once you’re on the Google Analytics page, you can click “Sign Up’ on the right hand side, and it will bring you through a series of prompts to fill out with your information and your website’s information to get the ball rolling. Also, Google Analytics tracks your audience’s behavior, so you’ll need a Privacy Policy online that let’s your audience know that your website tracks behaviors online. If you need a sample of a Privacy Policy to take a look at, then check out ours at www.paradisoinsurance.com/privacy-policy/. If you’re not exactly sure what you’re doing with writing a Privacy Policy though, seek professional help from a website designer or someone like an SEO specialist, which is who we go to for help at our agency.
Tracking Your Website’s Metrics
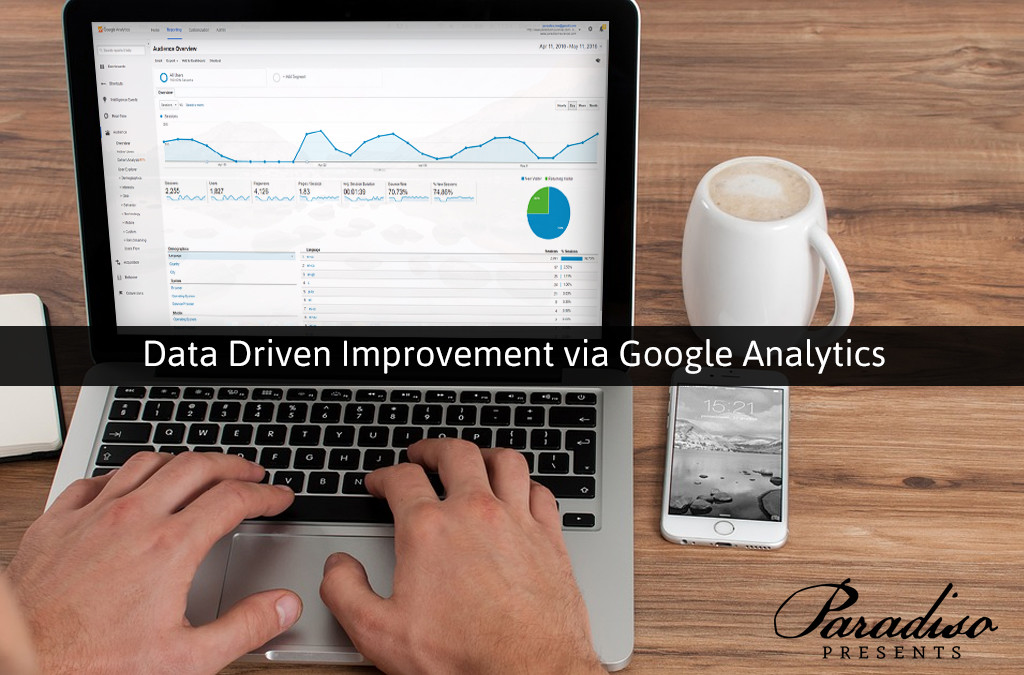
After you get things initially set up with your Google Analytics account and your website’s information is all synced up, you’ll be able to start tracking data, and data that is incredibly powerful. The main metrics that Analytics provides you with (right on their main dashboard when you sign in) is the number of sessions, users, page views, pages per session, average session duration, your bounce rate, and your percentage of new sessions on your website. Let’s talk about each of these metrics individually, but it’s important to note that within Google analytics, you can adjust the time frame of your data measured in the upper right hand corner of any screen. After you adjust the time frame you’d like to measure, you can look at your data accordingly. First, you have your number of sessions, which basically is the number of times your website is accessed. Next up, you have your users count, or the number of people who had accessed your website. After that is your page views, which is the total number of your website’s web pages that were accessed by your users. After that, you have your pages per session, which is the average number of total web pages someone visited while they were on your website. After that is your average session duration, and this is basically the average amount of time a person spends on your website whenever it is accessed. You can also track your bounce rate, which tells you how many people exited your website after viewing only one landing page. The last metric is the percentage of new sessions, which tells you how many people access your website are visiting for the first time.
Data Driven Improvement
So now that you have the data in front of you, what are you supposed to do with it? Well, thankfully Google is very specific and detailed in their tracking, so we can look for multiple places that we can maximize, optimize, and/or improve our presence online with all aspects of our digital marketing. First, you need to analyze some of the data on your Analytics dashboard, as ironic as that sounds. For each metric that we discussed above, you can actually click on them on your dashboard and get a graph, or a visual representation of the data. Anywhere the data dipped down too low, you can click on it on the graph to get a detailed report about what happened on that day, and figure out where you went wrong to eliminate your weaknesses. Similarly, you can also take a look at each day or spot on your charts that your data was very healthy, and figure out why, and then replicate that process in the future to get similar traction or results.
As an example, if I had one day that had a huge dip on my graph of users, I may want to investigate that day. If I click on it, and I realize that it was Christmas that day, then essentially there may be nothing wrong there, because you will simply get less traction online on a holiday. But, if I click into a day we had a dip and see that it’s a regular workday, and there were no outside influences that factored into my data, then it’s time to look at our posts and content for the day. We can compare the good days to the bad to see which content or posts performed better on each corresponding day, and leverage our future posts to get more engagement online.
At the end of the day, we are looking to get more engagement in the digital world. More people will see our message and brand, we will grow a larger audience, and overall, increase our agencies’ ROI’s. Figure out what’s working and what’s not, and optimize wherever you see the opportunity by having real, measurable data.
As always agents, happy marketing!